Protovis is a visualization toolkit for JavaScript using the canvas element. It takes a graphical approach to data visualization, composing custom views of data with simple graphical primitives like bars and dots. These primitives are called marks, and each mark encodes data visually through dynamic properties such as color and position. Although marks are simple by themselves, you can combine them in interesting ways to make rich, interactive visualizations.
To facilitate this, Protovis supports panels and inheritance. A panel is a container for marks; the contained marks are replicated for each data point on the panel. You can vary the panel position to create small multiple displays, or you can overlay panels. Inheritance lets you derive new marks from existing ones, while sharing some or all of the same properties. This is the same principle as cascading in CSS, or prototypal inheritance in JavaScript.
Please note: Protovis is in its early stages of development. At the moment, they only support Firefox 3, but they plan on adding support for Chrome and Safari 4.

Requirements: Firefox 3
Demo: http://vis.stanford.edu/protovis/ex/
License: BSD License
Diagrams are great, because they are a very simple and extremely efficient way to intelligibly represent even the most complex ideas. But drawing diagrams can also be very complicated, simply because most diagramming softwares require you to draw.
Lovely Charts is an online diagramming application, that allows you to create professional looking diagrams of all kinds, such as flowcharts, sitemaps, organisation charts, wireframes, and many more… for free.
With Lovely Charts’s extremely simple and intuitive drag’n drop drawing mechanism, you’ll be able to focus on what really matters. You won’t have to draw boxes and arrows, you won’t have to worry about what symbol to use.
Source: Lovely Charts
JS Charts is a free JavaScript based chart generator that requires little or no coding. With JS Charts drawing charts is a simple and easy task, since you only have to use client-side scripting (i.e. performed by your web browser). No additional plugins or server modules are required. Just include the scripts, prepare your chart data in XML or JavaScript Array and your chart is ready.
JS Charts lets you create charts in different templates like bar charts, pie charts or simple line graphs. It’s compatible with most web browsers. And it is It’s free to use and watermark-free.

Requirements: Firefox 1.5 +, IE 6, Safari 3.1 +, Opera 9 +
Demo: http://www.jscharts.com/examples
License: Creative Commons 3.0 License
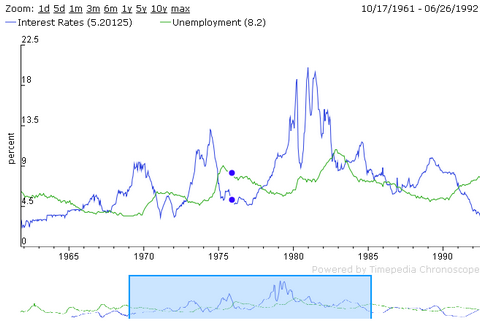
Chronoscope is an open source release of a charting and visualization platform for GWT, used as the centerpiece of Timepedia’s website. Chronoscope provides a high performance, cross browser platform for visualizing possibly large and complex datasets. It supports interactive framerates on datasets with tens of thousands of points by using multiresolution representation and incremental streaming.
When the number of points about to be plotted exceeds a certain heuristic, Chronoscope falls back to a lower resolution representation of the dataset, which can be provided by the user, or automatically calculated by various filtering algorithms. This is similar to mip-mapping techniques commonly used in 3D graphics to reduce bandwidth and decrease aliasing. It also gives non-programmers intuitive controls over almost every aspect of the look of a visualization.
Requirements: Google Web Toolkit
Demo: http://timepedia.org/chronoscope/
License: LGPL License
What if we want to include data visualization as an integral part of the site, not just an isolated figure or an interactive chart? When we’re designing interfaces for browsing data-driven sites, it’s valuable to be able to create navigation elements that are also visualization tools. We can keep the user informed as they explore, so they can make better decisions about what they’re looking at and what they’re clicking on.
What we need is something in between—markup that’s appropriate for navigation, but with some extra hooks for semantics and structure.
A List Apart has published an article of “Accessible Data Visualization with Web Standards“, shared three basic techniques for incorporating some simple data visualization into standards-based navigation patterns. All of them start with the building block of HTML navigation: an unordered list of links.
You should also look at Sparkline PHP Graphing Library. It provides a wide range of options how your graphs are rendered. It’s important that sparklines are visually appealing, especially in the restricted visual environment of the web. Web sparklines should approach as closely as possible the aesthetic of printed sparklines. Sparkline is completely free to use on your personal website, company home page, or to include in your commercial product. Sparkline is distributed under the BSD license.

A List Apart Article: Accessible Data Visualization with Web Standards
A List Apart Demo: http://alistapart.com/d/accessibledata/example-final.html
Sparkline PHP Graphing Library: http://sparkline.org/
License: BSD License
Canvas 3D Graph is a special type of bar graph that plot numbers in 3D. <canvas> tag is not supported in IE, so the author was forced to use excanvas.js in order to draw graph in IE. As the result of that, you may experience some freezes when you try to plot large amount of data in IE. Firefox and safari works just fine (aprox 10x faster than emulated canvas in IE). This is initial release, he planned to add many more features, so stay stay tuned for the updates.

Requirements: –
Demo: http://dragan.yourtree.org/code/canvas-3d-graph/
License: BSD License
Flotr is the replacement of Solutoire Plotr which is a javascript plotting library based on the Prototype Javascript Framework and inspired by Flot. Flotr enables you to draw appealing graphs in most modern browsers with an easy to learn syntax. It comes with great features like legend support, negative value support, mouse tracking, selection support, zoom support, event hooks, CSS styling support and much more.

Requirements:Prototype 1.6.0.2+, excanvas.js (included in the Flotr zip file)
Demo: http://solutoire.com/flotr/docs/
License: MIT License
pChart is a PHP class oriented framework designed to create aliased charts. Most of todays chart libraries have a cost, pChart is intended to be free. Data can be retrieved from SQL queries, CSV files, or manually provided. Focus has been put on rendering quality introducing an aliasing algorithm to draw eye candy graphics. This project is still under development and new features or fix are made every week.


Requirements: PHP
Demo: http://pchart.sourceforge.net/demo.php
License: GPL License
Visifire is a set of open source data visualization components – powered by Silverlight. With Visifire you can create and embed visually stunning animated Silverlight Charts within minutes. Visifire is easy to use and independent of the server side technology. It can be used with ASP, ASP.Net, PHP, JSP, ColdFusion, Ruby on Rails or just simple HTML. Visit Visifire Gallery or design your own chart using Chart Designer.


Requirements: –
Demo: http://www.visifire.com/
License: GPL License
JavaScript Information Visualization Toolkit (JIT) is an advanced JavaScript infovis toolkit that was based on 5 papers regarding different information visualization techniques. The JIT implements advanced features of information visualization like Treemaps (with the slice and dice and squarified methods), an adapted visualization of trees based on the Spacetree, a focus+context technique to lay Hyperbolic Trees, and a radial layout of trees with advanced animations (RGraph).


These are the different features of the JIT toolkit. It’s still on an alpha state, but it’s very well documented and on active development. The library consists on standalone libraries. That means at the moment you won’t be able to include more than one visualization library per page.
Requirements: –
Demo: http://blog.thejit.org/?page_id=14
License: Creative Commons 3.0 License


