Smoothie Charts is a really small charting library designed for live streaming data. Joe Walnes wanted to show real time streaming data pushed over a WebSocket. Although many of the charting libraries allow you to dynamically update data, none have really been optimized for a constant stream of data.
Smoothie Charts only works on Chrome and Safari. And it doesn’t support legends. Or pie-charts. In fact, it’s inferior in virtually every way to a library like Flot. But, it’s very good at displaying streaming data.

Requirements: Chrome and Safari 5
Demo: http://smoothiecharts.org/
License: MIT License
HumbleFinance is an HTML5 data visualization tool written as a demonstration of interactive graphing in HTML5. It is similar to the Flash tool on Google Finance. The tool itself is written entirely in JavaScript, using the Prototype and Flotr libraries. It can be used to display any two 2-D data sets of real numerical data which share an axis.
You can mouse over the chart for additional data, as well as zoom and pan the charts using the grey bottons. For best results view with FireFox, Chrome, or Safari.

Requirements: Prototype 1.6.1+, Flotr 2.0 (modified)
Demo: http://www.humblesoftware.com/finance/index
License: MIT License
BirdEye is the Declarative Visual Analytics Library. It is a community project to advance the design and development of a comprehensive open source information visualization and visual analytics library for Adobe Flex. The actionscript-based library enables users to create multi-dimensional data visualization interfaces for the analysis and presentation of information.
DVAL is a XML-based syntax language for specifying visual representations. The approach is based on the concepts of Leland Wilkinson’s book The Grammar of Graphics. In this book he describes a foundation for producing a comprehensive information visualization language. The advantage of the DVAL is that all visuals are created using the same structure and logic.

Requirements: –
Demo: http://birdeye.googlecode.com/svn/branches/ng/examples/demo…
License: MIT License
dhtmlxGantt is a JavaScript component that allows you to create dynamic Gantt chart and visualize a project schedule in a convenient graphical way. With dhtmlxGantt you can display dependency relationships between activities, show current schedule status with percent-complete shadings and organize the activities into a tree structure.
The component works in all major web-browsers, including IE, Mozilla, Opera, Chrome. You can initialize the chart from XML or through JavaScript API. All the changes made in the chart structure on a web page can be saved back to the server on the fly (in XML form) with a single function call.

Requirements: JavaScript Enabled
Demo: http://dhtmlx.com/docs/products/dhtmlxGantt/
License: GPL License
jsPlumb jQuery plugin provides a means for a developer to visually connect elements on their web page, in much the same way you might have seen on Yahoo Pipes. jsPlumb allows you to connect elements on the screen with “plumbing”, using a Canvas element when supported, and Google’s ExplorerCanvas script to support older browsers. Full transparent support for jQuery dragging is included, the API is super simple, and the compressed version of the script is just 10.5K.
It relies on jQuery 1.3.x or jQuery 1.4.x (tested on 1.3.2 and 1.4.2), and also jQuery UI 1.7.2 (if you want to support dragging). For Canvas support in IE you also need to include Google’s ExplorerCanvas script.

Requirements: jQuery Framework
Demo: http://morrisonpitt.com/jsPlumb/html/demo.html
License: MIT License
Grafico is a javascript charting library built with Raphaël and Prototype.js. The library provides a wide array of graphs and stays with the guidelines laid out by Stephen Few and Edward Tufte. Grafico provides pretty charts that effectively communicate their information.
This means you get awesome graphs such as stacked area charts and sparklines, but no pie charts or bar charts with every bar a different color. Each graph type has numerous API options to customize it’s look and behavior. Some highlights: pop-up hovers, meanlines and watermarks. Minified, Grafico is about 30kb and available under the MIT license.

Requirements: Raphaël and Prototype.js
Demo: http://kilianvalkhof.com/2010/design/grafico-javascript-charting-library/
License: MIT License
dygraphs is an open source JavaScript library that produces produces interactive, zoomable charts of time series. It is designed to display dense data sets and enable users to explore and interpret them. You can mouse over to highlight individual values. Click and drag to zoom. Double-click to zoom back out. Change the number and hit enter to adjust the averaging period.
Another significant feature of the dygraphs library is the ability to display error bars around data series. dygraphs is purely client-side JavaScript. It does not send your data to any servers – the data is processed entirely in the client’s browser.

Requirements: JavaScript Enabled
Demo: http://www.danvk.org/dygraphs/
License: License Free
Highcharts JS is a charting library written in pure JavaScript, offering an easy way of adding interactive charts to your web site or web application. Highcharts JS currently supports line, spline, area, areaspline, column, bar, pie and scatter chart types.
It works in all modern browsers including the iPhone and Internet Explorer from version 6. Setting the Highcharts configuration options requires no special programming skills. The options are given in a JavaScript object notation structure, which is basically a set of keys and values connected by colons, separated by commas and grouped by curly brackets.
On hovering the chart, Highcharts JS can display a tooltip text with information on each point and series. By zooming in on a chart you can examine an especially interesting part of the data more closely. Zooming can be in the X or Y dimension, or both. Highcharts is licensed under a Creative Commons Attribution-NonCommercial 3.0 License.

Requirements: Javascript Enabled
Demo: http://www.highcharts.com/demo
License: Creative Commons License
Filament Group wrote an article describing how to use JavaScript to scrape data from an HTML table and generate charts using the HTML 5 Canvas element. The technique is particularly useful because the data for the visualization already exists in the page in structured tabular format, making it accessible to people who browse the web with a screen reader or other assistive technology.
Now they have rewritten and extended the code behind the technique and packaged it up as a new jQuery plugin called “Visualize“, which you can download. The plugin provides a simple method for generating bar, line, area, and pie charts from an HTML table, and allows you to configure them in a variety of ways.

Requirements: IE6, IE7, IE8, Firefox 2, Firefox 3.5, Safari 3 and 4, Opera 9
Demo: http://www.filamentgroup.com/examples/charting_v2/index_2.php
License: MIT, GPL License
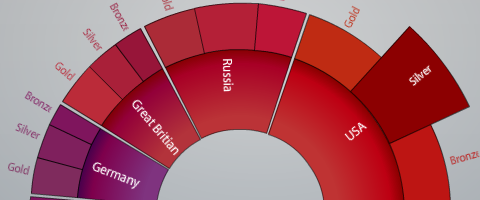
Axiis is an open source data visualization framework designed for beginner and expert developers alike. Axiis gives developers the ability to expressively define their data visualizations through concise and intuitive markup.
Axiis provides both pre-built visualization components as well as abstract layout patterns and rendering classes that allow you to create your own unique visualizations. Axiis was designed to be a granular framework, allowing developers to mix and match components and build complex output by compositing together basic building blocks.
Axiis is an open source project, under an MIT license. This means you can use it for personal projects, commercial work, and pretty much anything you can think of with no restrictions.
Requirements: Degrafa Graphics Framework & Adobe Flex 3
Demo: http://www.axiis.org/examples.html
License: MIT License


