Open Flash Chart is a charting component made by Flash. Open Flash Chart, is open source. It is free to use and you get the source code to fiddle with. You can create some really nice looking Bar Charts, Pie Charts, Area Charts and etc… easily. To use it, you simply need to include the Open Flash Chart in your HTML, and provide the data file on the server. The data file is either a text file, or a .php, Perl, Python, Java (or another flavour of dynamic) page.


Requirements: Flash 8+
Demo: http://teethgrinder.co.uk/open-flash-chart/
License: GPL License
We have been waiting so long for Google Chart API. Google has finally released Google Charts API, which returns a PNG-format image in response to a URL. Several types of image can be generated: line, bar, and pie charts for example. For each image type you can specify attributes such as size, colors, and labels.
You can include a Chart API image in a webpage by embedding a URL within an <img> tag. When the webpage is displayed in a browser the Chart API renders the image within the page.

The chart above is generated dynamically and displayed in your browser with the following code.
<img src="http://chart.apis.google.com/chart?cht=p3&chd=s:hW&chs=480x150&chl=Large Portion|Small Portion">
Go and check out the developer’s guide of Google Chart API now.
Requirements: No Requirements
Demo: http://code.google.com/apis/chart/
License: License Free
Flot is a pure Javascript plotting library for jQuery. It produces graphical plots of arbitrary datasets on-the-fly client-side. The focus is on simple usage (all settings are optional), attractive looks and interactive features like zooming. Although Flot is easy to use, it is also advanced enough to be suitable for Web 2.0 data mining/business intelligence purposes which is its original application. The plugin is targeting all newer browsers.

Requirements: No Requirements
Demo: http://code.google.com/p/flot/
License: MIT License
Flare is a collection of ActionScript 3 classes for building a wide variety of interactive visualizations. For example, flare can be used to build basic charts, complex animations, network diagrams, treemaps, and more. Flare is written in the ActionScript 3 programming language and can be used to build visualizations that run on the web in the Adobe Flash Player.
Flare applications can be built using the free Adobe Flex SDK or Adobe’s Flex Builder IDE. Flare is based on prefuse, a full-featured visualization toolkit written in Java. Flare is open source software licensed under the terms of the BSD license, and can be freely used for both commercial and non-commercial purposes.
Requirements: Flash
Demo: http://flare.prefuse.org/demo/
License: BSD License
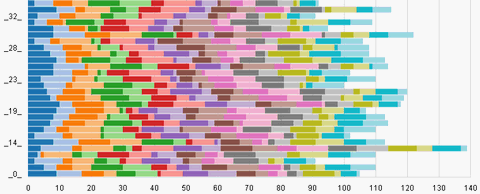
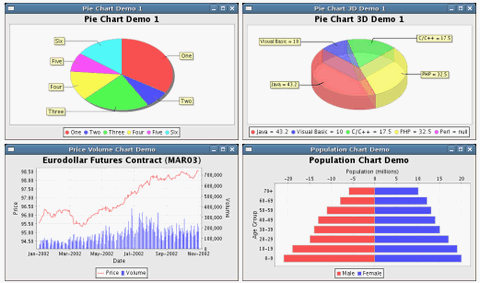
JFreeChart is a free 100% Java chart library that makes it easy for developers to display professional quality charts in their applications.The JFreeChart project was founded seven years ago, in February 2000, by David Gilbert. Today, JFreeChart is used by approximately 40,000 to 50,000 developers. JFreeChart’s extensive feature set includes:
- a consistent and well-documented API, supporting a wide range of chart types.
- a flexible design that is easy to extend, and targets both server-side and client-side applications.
- support for many output types, including Swing components, image files (including PNG and JPEG), and vector graphics file formats (including PDF, EPS and SVG).
- JFreeChart is “open source” or, more specifically, free software. It is distributed under the terms of the GNU Lesser General Public Licence (LGPL), which permits use in proprietary applications.
Requirements: Java 2 platform (JDK version 1.3 or later)
Demo: http://www.jfree.org/jfreechart/samples.html
License: LGPL License
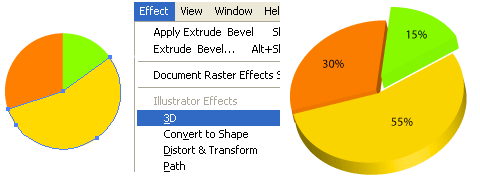
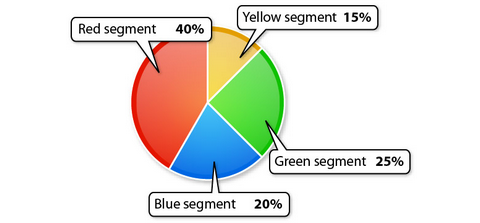
Are you still using the traditional 2D graph for your reports and presentations? N.Design Studio taught us how to create 3D Pie Charts with Illustrator CS2 at ease. The Pie Charts looks so real and professional.
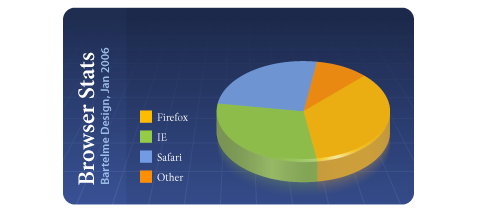
As a freelancer, we may come into the situation that you have to present some sort of statistical data to your client. Of course you may use Excel’s graph tool to easily create a bunch of charts, but more or less all of those predefined designs suck. Bartelme Design show us how to create visually appealing Pie charts using Adobe Illustrator’s graph tool.
GoSquared showed us how to create beautiful Pie Charts in Illustrator. Just follow a few simple steps, and you’ll view pie charts in a whole new light.
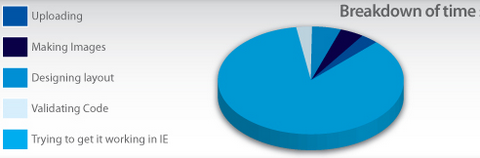
IMmodernLife created a comprehensive tutorial of how to make overwhelming niceness of the Pie Charts. He is using Adobe Illustrator CS2, but the tips should apply to most of the more recent versions.
Requirements: Adobe Illustrator
Demo 1: http://www.ndesign-studio.com/resources/tutorials/3d-graphs/”
Demo 2: http://bartelme.at/journal/archive/creating_graphs/journal/281/
Demo 3: http://www.gosquared.com/liquidicity/archives/103
Demo 4: http://www.modernlifeisrubbish.co.uk/article/howto…
License: License Free
FusionCharts Free is a flash charting component that can be used to render data-driven & animated charts for your web applications and presentations. It is a cross-browser and cross-platform solution that can be used with ASP.NET, ASP, PHP, JSP, ColdFusion, Ruby on Rails, simple HTML pages or even PowerPoint Presentations to deliver interactive and powerful flash charts. You do NOT need to know anything about Flash to use FusionCharts. All you need to know is the language you’re programming in.
The free version offers you most of the features that you would normally need. If the features in free version does not satiate your requirements, you might consider a paid version. In contrast, offers a lot more advanced options like gradients, 3D Lightings (shadow, blur effect, glow effect and bevel), custom animations, in-built debuggers, more chart types, enhanced AJAX support, data-driven flash maps, loading into other Flash movies, personalized implementation support etc.
If you are interested, you may want to look at FusionCharts Google Gadget as well.

Requirements: Flash Support
Demo: http://www.fusioncharts.com/Free/Gallery.asp
License: License Free
PHP/SWF Charts is a simple, yet powerful PHP tool to create attractive web charts and graphs from dynamic data. Use PHP scripts to generate or gather the data from databases, then pass it to this tool to generate Flash (swf) charts and graphs. PHP/SWF Charts makes the best of both the PHP and SWF worlds. PHP scripts provide integration, and Flash provides the best graphic quality. It supports many charts types, Line, Column, Stacked column, Floating column, 3D column, Stacked 3D column, Parallel 3D column, Pie, 3D Pie, Bar, Stacked bar, Floating bar, Area, Stacked area, Candlestick, Scatter, Polar, Mixed, Composite and Joined. Can you ask for more? They have the following main features.
- Web charts and graphs from dynamic data
- Live and interactive chart updates without reloading the web page
- Clickable charts, and drill-down
- Animated transitions
- Printable charts
- Simple and flexible chart generation
PHP/SWF Charts is free to download and use. The free, unregistered version contains all the features except for:
- Clicking a chart takes the user to the PHP/SWF Charts web site
- No displaying charts inside another flash file
- No technical support, and no product updates by e-mail

Requirements: Flash Player 6+, Server with PHP Support
Demo: http://www.maani.us/charts/index.php?menu=Gallery
License: License Free
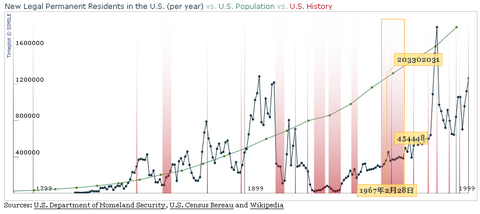
Timeplot is a DHTML-based AJAXy widget for plotting time series and overlay time-based events over them (with the same data formats that Timeline supports). Just like Timeline or Google Maps, Timeplot can be used with zero software installation, server-side or client-side. You can populate Timeplot with data by pointing it to an space or comma separated file. Timeplot also supports Timeline’s XML format, meaning that you can reuse the same data file of your Timeline and overlay them over a time series plot. It looks so specialized and works smoothly. It is a very great charts tool to represent complex data.
Requirements: Any Browsers supprts Javascript
Demo: http://simile.mit.edu/timeplot/
License: BSD License
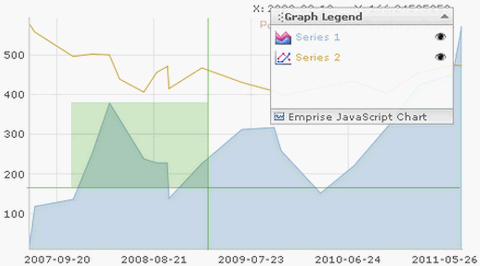
A set of Emprise Javascript Charts ( Line, Area, Scatter, Pie, Bar and Function series ) with zooming, scaling and scrolling ablity. Built with compatibility in mind and tested on all major browsers, you can be assured your charts will function consistently for the broadest range of end users. Every aspect of the charting display can be configured and customized through well-documented properties and methods. It is free for everyone unless you want extra features.
Requirements: Safari, Camino, Firefox and Internet Explorer 6+, Opera
Demo: http://www.ejschart.com/examples/index.php
License: License Free


