Treed is a Powerful Tree Editing Component. Treed wants to be for tree editing what ace is for text editing. Extensible, customizible, powerful, and just plain easy to use.
Treed is constructed using the MVC pattern such that it is simple to, for example, create an entirely different view for the tree. You can also create your own “Node” class if you wanted to do more than just have a single text input. You could add buttons, more fields, whatever you want.
Requirements: –
Demo: http://jaredly.github.io/treed/
License: License Free
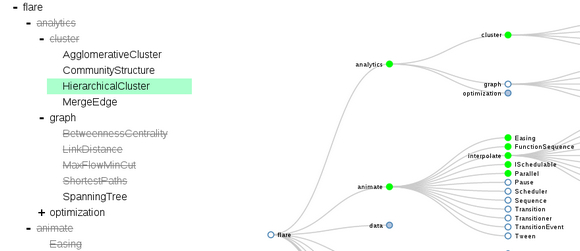
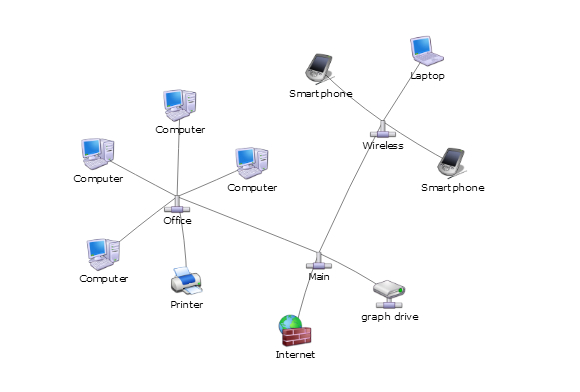
Vis.js is a dynamic, browser based visualization library. The library is designed to be easy to use, handle large amounts of dynamic data, and enable manipulation of the data.
The library consists of the following components: DataSet and DataView. A flexible key/value based data set. Add, update, and remove items. Subscribe on changes in the data set. Filter and order items and convert fields of items. Timeline. Display different types of data on a timeline. The timeline and the items on the timeline can be interactively moved, zoomed, and manipulated. Graph. Display an interactive graph or network with nodes and edges.
Requirements: –
Demo: http://visjs.org/
License: Apache License
Planetary.js is a javaScript library for building awesome interactive globes. It uses D3 and TopoJSON to parse and render geographic data. Planetary.js uses a plugin-based architecture; even the default functionality is implemented as plugins! This makes Planetary.js extremely flexible.
It’s fully customizable, including colors, rotation, and more. You can also display animated “pings” at any location with custom colors and sizes. It supports Mouse drag and zoom. Best of all, it’s 100% free and open source, licensed under the MIT license.

Requirements: JavaScript Framework
Demo: http://planetaryjs.com/
License: MIT License
Pizza Pie Charts is a responsive Pie chart based on the Snap SVG framework from Adobe. It focuses on easy integration via HTML markup and CSS instead of JavaScript objects, although you can pass JavaScript objects to Pizza as well.
You can deliver pie charts to any device with Pizza. Your pie will be steaming hot with SVG so that it looks good on retina devices and HiDPI devices. And the pie will fit the width of your box — um, container — or can be given a max-width or max-height.

Requirements: Sass Framework
Demo: http://zurb.com/playground/pizza-pie-charts
License: MIT License
Ember Charts is a charting library built with the Ember.js and d3.js frameworks. It includes time series, bar, pie, and scatter charts which are easy to extend and modify. The out-of-the-box behavior these chart components represents their thoughts on best practices in chart interactivity and presentation.
It is highly customizable and extensible. You can add legends, labels, tooltips, and mouseover effects. You can also roll your own charts by extending our ChartComponent class – get labels, automatic resizing, and reasonable defaults for margins, padding, etc.
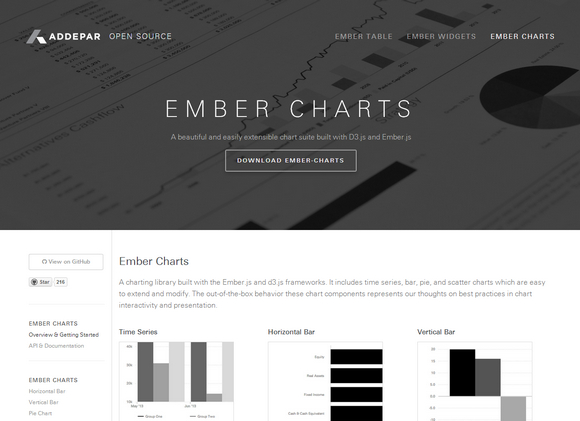
Requirements: D3.js and Ember.js
Demo: http://addepar.github.io/#/ember-charts/
License: License Free
In this article, we’ll get rolling on developing plug-in free by creating bar graphs and similar graphics, using NASDAQ’s current web site as an example. But we won’t be creating merely a picture of a bar graph, but a real, interactive bar graph. Let’s take a look at an existing site that uses Flash, then build one using HTML5.
If you have Flash installed, you’ll see a fancy line chart. You can float your mouse over the line and see a small popup showing the stock price at that point, along with the volume of trading, like so:

If you don’t have Flash installed, then the site just shows you a graphic image. So you’re not left out completely without Flash, but with HTML5, we can include everybody.
Now, we’ll build something similar. To keep this article from getting too long, let’s just show the data in a box below the graph. But as you move the mouse along the graph, or touch it on a tablet, it will highlight the closest point on the graph, and show the information for that point in a box. Here’s what the final product will look like: Read the rest of this entry »
OOcharts is the Simple API for Google Analytics. It is an awesome little project that makes it easy to embed and share Google Analytics data through charts. API Keys are created to give access to certain Google Analytics profiles. For every request to OOcharts, you will need a valid API Key.
They queue your requests that would normally exceed the Google Analyticsâ„¢ API limits to ensure you get your data fast and reliably. They also cache requests so you don’t have to waste time waiting for the same report you asked for a couple seconds ago. As soon as you connect your Googleâ„¢ profile and make an API Key for your site, you can start getting data. You can fork OOcharts on Github too.
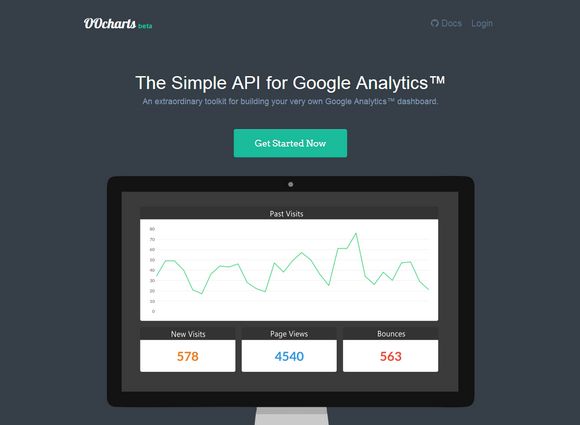
Requirements: JavaScript Enabled
Demo: http://oocharts.com/
License: License Free
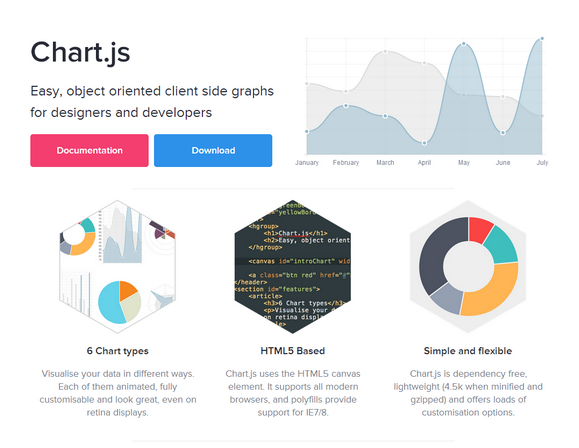
Chart.js is an easy, object oriented client side graphs for designers and developers. You can visualise your data in 6 different ways. Each of them animated, fully customizable and look great, even on retina displays. Chart.js uses the HTML5 canvas element. It supports all modern browsers, and polyfills provide support for IE7/8.
Chart.js is dependency free, lightweight (4.5k when minified and gzipped) and offers loads of customization options. it is licensed under MIT License.
Requirements: HTML5 Framework
Demo: http://www.chartjs.org/
License: MIT License
Aristochart is highly customizable and flexible line charting library for <canvas>. Aristochart allows you to focus on aesthetic while it manages the data behind the scenes. Aristochart has a growing list of community sourced themes for you to pick and choose from.
Aristochart has indepth documentation of it’s internals and options that you can edit and extend. All packaged together and works locally. Aristochart is completely open-source and hosted on Github.

Requirements: Canvas
Demo: http://dunxrion.github.io/aristochart/
License: MIT License
Charts are a great visual aid when presenting data. You can’t build a professional admin panel without them. They are also tricky to set up. However, there is a new library that makes things easier – xCharts.
TutorialZine has published an article: Make Pretty Charts for Your App with jQuery and xCharts, that used xCharts along with the daterange picker for Twitter Bootstrap, to build a pretty, AJAX-powered chart for your web application that fetches data from a MySQL table.

Requirements: JavaScript and MySQL
Download Link: http://demo.tutorialzine.com/2013/01/charts-jquery-ajax/
License: License Free


