Chart.js is a simple yet flexible JavaScript charting for designers & developers. Chart.js merges configurations and options in a few places with the global defaults using chart type defaults and scales defaults. This way you can be as specific as you want in your individual chart configs, or change the defaults for Chart.js as a whole. Chart.js offers support for all browsers where canvas is supported. Chart.js is open source and available under the MIT license.
Requirements: –
Demo: http://www.chartjs.org/
License: MIT License
At StatHat, they make a lot of charts. They creates dynamic, autoupdating charts using JavaScript, but we also send charts via email and to external services like Campfire and Slack. Plus, they let users embed charts on their own web pages. For these situations, JavaScript charts either won’t work, are overkill, or could get messy.
So they made chartd. It allows you to create a chart with just an img tag. These charts:
- are responsive (resize this page to see the charts respond)
- are retina-friendly
- can contain up to 5 datasets
- can be line or step charts
- have customizable colors and strokes
No JavaScript is required. You can generate SVG or PNG charts. We prefer SVG, but some services (like gmail) won’t render SVGs in emails.

Requirements: –
Demo: http://chartd.co/
License: License Free
Dynamics.js is a JavaScript library to create physics-based animations. Simply include dynamics.js into your page, and then you can animate CSS properties of any DOM element. You also can animate SVG properties. Dynamics.js has its own setTimeout. The reason is that requestAnimationFrame and setTimeout have different behaviors. And any JavaScript object. It has been tested on Safari 7+, Firefox 35+, Chrome 34+, IE10+.

Requirements: javaScript Framework
Demo: http://dynamicsjs.com/
License: MIT License
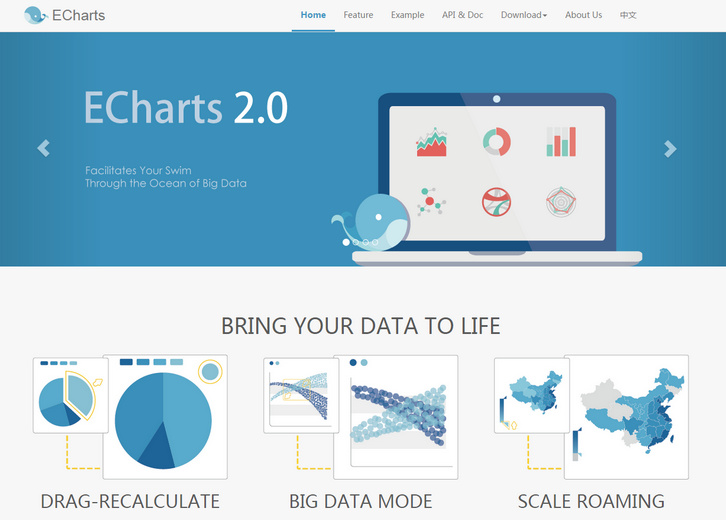
ECharts is a comprehensive charting library offering a painless way of adding interactive charts to your commercial products. On the foundation of ZRender-based (a whole new lightweight canvas library) coordinate system, legend, tooltip, toolbox and other basic components, ECharts currently supports line, column, scatter, pie, radar, candlestick, chord, gauge, funnel, map and force-directed chart types, many of these can be combined in one chart.
It’s compatible with most common browsers — including IE6/7/8/9+, Chrome, Firefox, Safari and Opera. Compared with a single chart, a combination of charts can be more expressive and more interesting. ECharts supports any combination of any chart provided herein (a total of 11 types and 17 subtypes).
Requirements: JavaScript Framework
Demo: http://ecomfe.github.io/echarts/index-en.html
License: Copyright (c) 2013, Baidu Inc
Building an analytics dashboard? Don’t start from scratch. Grab one of Keen IO Bootstrap-based Dashboards Templates and admire your data in minutes. You can create an attractive, custom analytics dashboard that’s ready to be shown to your team or your customers. No hours lost tweaking CSS or testing responsiveness on eight different mobile devices.

Requirements: Bootstrap Framework
Demo: http://keen.github.io/dashboards/
License: MIT License
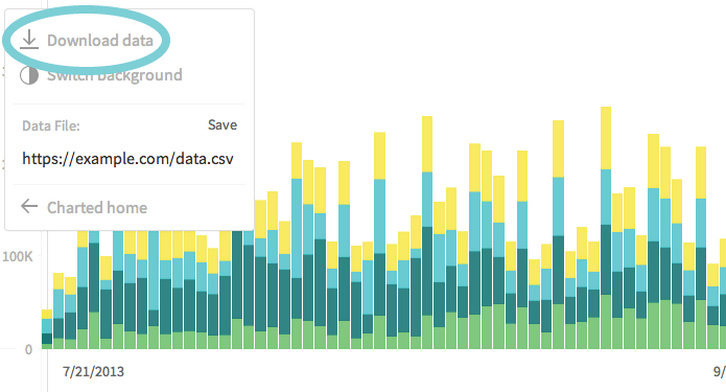
Charted is a tool for automatically visualizing data, created by the Product Science team at Medium. Give it the link to a data file and Charted returns a beautiful, shareable chart of the data. Charted does not store any data. It only fetches and visualizes what the link provides. It also refetches the data every 30 minutes, so the chart is always up-to-date.
Charted is open-sourced and available for anyone to use at charted.co. The publicly-hosted charted.co works with files that are already publicly accessible to anyone with the link (e.g., Dropbox share links). For protected or sensitive data, you can serve your own instance of Charted on your secure network.
Requirements: –
Demo: http://www.charted.co/
License: MIT License
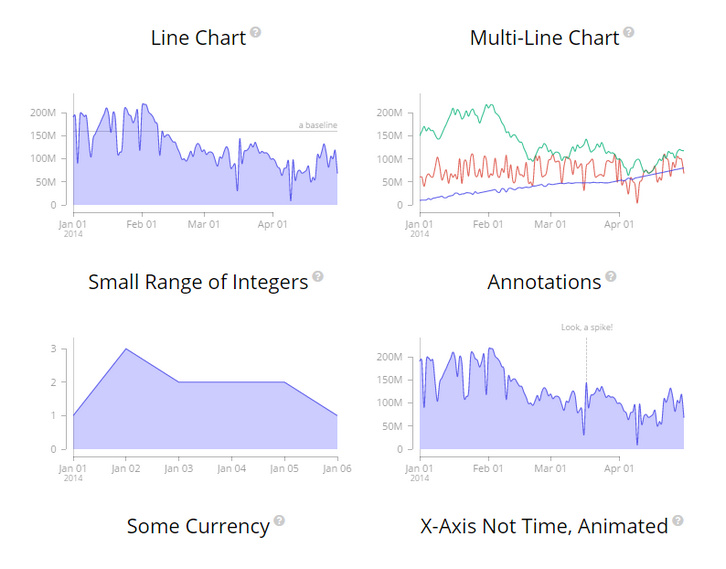
MetricsGraphics.js is a library built on top of D3 that is optimized for visualizing and laying out time-series data. It provides a simple way to produce common types of graphics in a principled, consistent and responsive way. The library currently supports line charts, scatterplots and histograms as well as features like rug plots and basic linear regression.
The API is simple. All that’s needed to create a graphic is to specify a few default parameters and then, if desired, override one or more of the optional parameters on offer. The library is data-source agnostic. While it provides a number of convenience functions and options that allow for graphics to better handle things like missing observations, it doesn’t care where the data comes from.
Requirements: D3 Framework
Demo: http://metricsgraphicsjs.org/examples.htm
License: Mozilla Public License v2.0
Chartist.js is a simple responsive charting library built with SVG. Chartist’s goal is to provide a simple, lightweight and non-intrusive library to responsive craft charts on your website. It’s important to understand that one of the main intentions of Chartist.js is to rely on standards rather than providing a own solution to the problem which is is already solved by the standard.
Chartist works with inline-SVG and therefore leverages the power of the DOM to provide parts of its functionality. This also means that Chartist is not providing it’s own event handling, labels, behaviors and anything else that can just be done with plain HTML, JavaScript and CSS.

Requirements: JavaScript Framework
Demo: http://gionkunz.github.io/chartist-js/
License: License Free
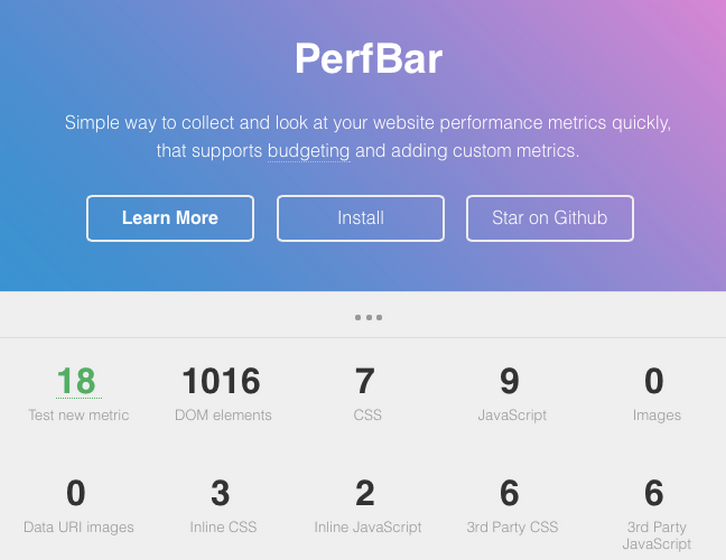
PerfBar is a simple way to collect and look at your website performance metrics quickly, that supports budgeting and adding custom metrics. PerfBar is a tool that puts dozens of metrics at the tip of your fingers with just a single script include.
Once set up, PerfBar adds a collapsable bar to the bottom of your website that displays the metrics for the current session. Here’s what it looks like in action on the project’s homepage.
Requirements: –
Demo: http://lafikl.github.io/perfBar/
License: MIT License
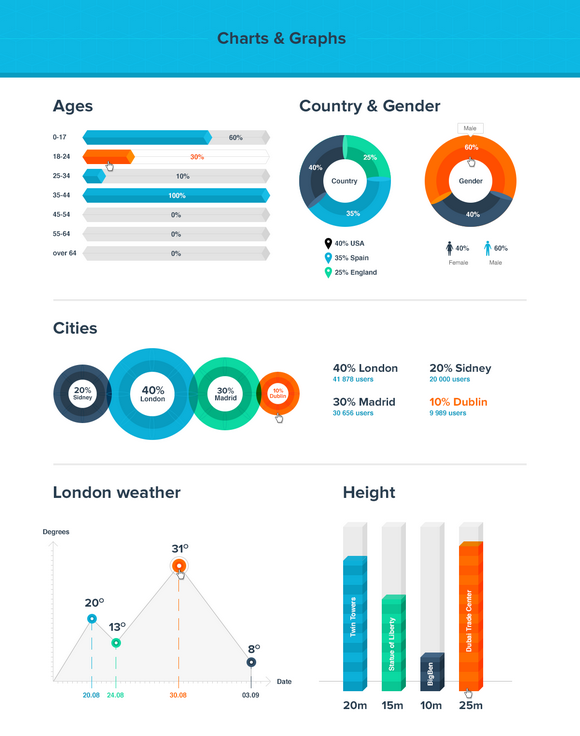
Both diagrams and charts are pictorial representations of information. Both are used to communicate visually, and both try to simplify the information they’re conveying. They’re also a great way to track trends and help explain complex datasets.
Have you ever encounter situations where you need to create a simple yet good-looking chart? That’s why we have created this Charts and Diagrams Kit, containing some of the most popular chart elements, which will help you design charts and graphs in Photoshop with ease. It includes bar chart, line chart, pie chart, timeline chart, circular chart, stats chart, map chart, slider and etc. Best of all, it’s free for download in PSD format.
Read the rest of this entry »


