PHP Quick Profiler – Firebug for PHP
Code reviews play an integral part in the development process for making quality software. We can find out security holes, memory leaks, poor queries and heavy file structures from code reviews. Unfortunately, these reviews are also very time consuming.
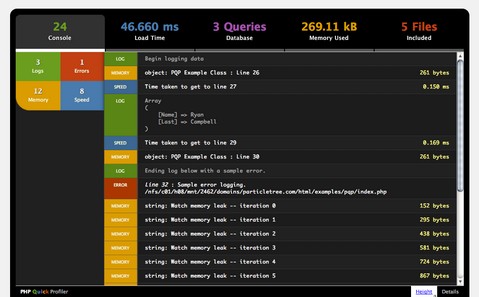
We spend a lot of time echoing queries, memory stats and objects to the browser just to see how they are being used in the code. To reduce this repetition, Ryan Campbell has invested some time creating the PHP Quick Profiler (PQP). It’s a small tool (think Firebug for PHP) to provide profiling and debugging related information to developers without needing them to add a lot of programmatic overhead to their code.
Now, we only need to toggle one config setting to true and we can have access to an automated tool to help create a faster and more consistent review experience. Since anyone can use it, PQP also gives the initial developer an idea of where their code stands before the review.
Requirements: –
Demo: http://particletree.com/examples/pqp/
License: License Free