Soon after the online shopping trend first took hold, the number of eCommerce-related websites began to steadily increase as more and more people became comfortable with the online shopping concept, and began shopping from their PCs in the comfort of their own homes. With the advent of handheld devices, savvy shoppers began to use their tablets and phones to shop whenever and from wherever they wished, even though the manner in which information was displayed on these devices often left much to be desired.
Thegrowing number of shoppers using mobile devicesbrought about the next trend; Responsive multipurpose themes. The advent of the responsive theme resolved many of the difficulties users encountered when attempting to surf the Internet using their phones or tablets. A new trend now appears to be taking shape. It is the use ofeCommerce-focused multipurpose themes that enable developers to create feature-packed, easy to navigate, and user-friendly websitesfor all online shoppers.
Features eCommerce Themes must have to be Competitive
The number of design options currently available to web developers is virtually limitless, yet any eCommerce site, in particular one builtupon a multipurpose WordPress theme, must display certain features or characteristics if it is going to attract a large customer base.
Themes that can enable a developer to easily create an acceptable end product must be flexible and versatile enough to produce fast loading, easily navigable, attention-grabbing pages. Design elements and options such as shopping carts, reviews, and testimonial pages, ordering and wish list pages, and other commerce-related features must be readily accessible, and easily incorporated into a website.
eCommerce oriented pre-made layouts, user friendly page building and admin features, and responsive and retina ready, cross-browser and multi-platform compatible features must be characteristics of any theme. The resulting website pages must be informative, and they must be attention grabbing.
With these features tools in hand, a website developer is in a position to make it all happen. All that remains is to select a theme that not only has these features, but a theme that has an abundance of elements and design options, giving the developer the flexibility needed to create jaw-dropping web pages. Read the rest of this entry »
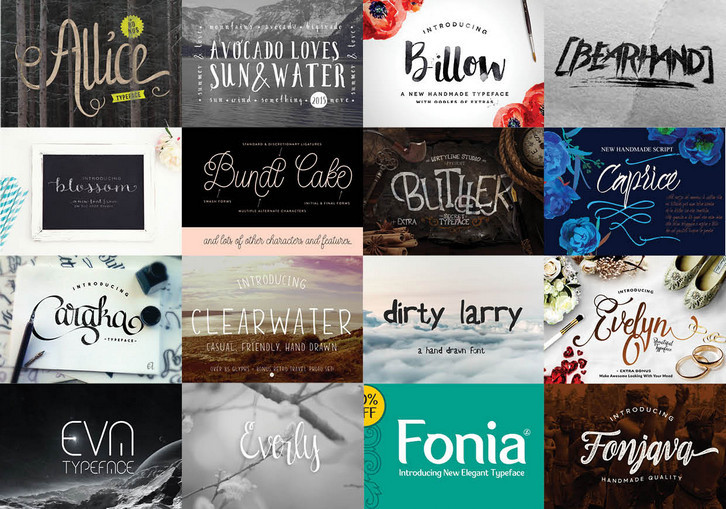
Fonts present us with imagery that enhances the theme or distracts from it, utilizing the Big Font Bundle, enables online licensing that offers options with real time visual cues to the style you want. The visual balance within the media presentation has everything to do with the Font. A complete feeling can be transmitted at first glance.
This Big 50 Font Bundle is accessible on all programs, some fonts offer dingbats and/or ornaments, many of them include extra design features and some of them include open type features.
An amazing value for both the beginner and experienced project designer, this font package allows the art to be expressed by the imagery of the words, enhancing the emotional style with each statement. Increase production with the ease of selection and delivery. This amazing The Big 50 Font Bundle is available for just $29. Hurry, as this offer of 96% off the $850 retail price is only available for the month of June.
It’s a must to possess an URL of your business, hobby, blog, product, you name it, but you also need to do it right and fast.Your online presence is your new business card so make sure you’re aware of it.
Starting from here, is time to simplify everything in terms of building a single page website: information architecture, customer journey, user interface and experience and everything related. You can easily do that if you choose to use Qards – a robust visual editor for WordPress.
Stick to next lines and find out more about the positive impact that Qards could bring into your life and your clients’ businesses as well. Below, you can fully understand how this design plugin works at its best. Read the following step-by-step guide and let yourself be surprised in a beautiful and engaging way.
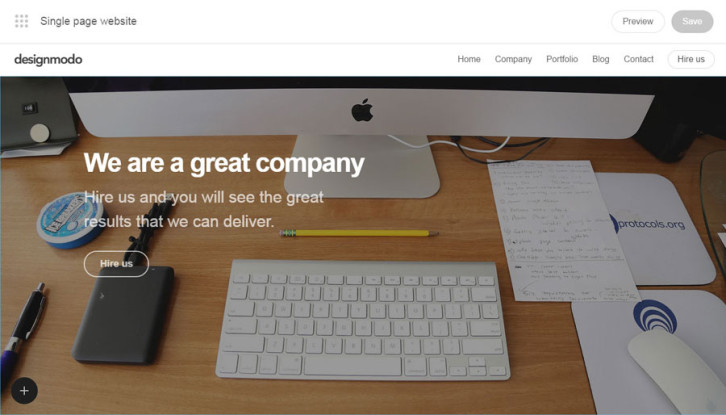
Step 1
Let’s start with the basics: create a new single page with Qards and make sure you give a relevant and easy-to-remember name. Enter the main menu by clicking on the + symbol from the left-corner. To add a beautiful image in the cover sections just select the Image option (from the menu, of course) and click on it. Now, you can edit whatever you feel like editing.
For example, we choose to add some text and a call to action button. You can do that in minutes. Also, you have the creative freedom to modify the font and its size, but also the color. Let’s move on.
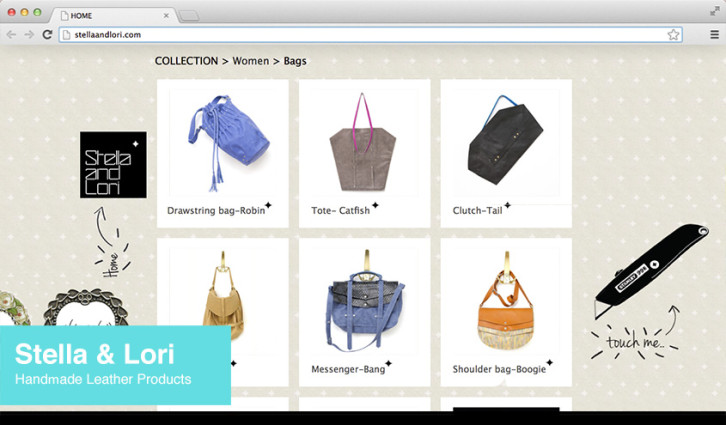
Step 2
Next, dive deeper and learn how to easily add a case-study. Choose the Grid button and select one of the many pre-designed cards. You can opt for different types of grid in order to match your needs. On top of that, don’t forget that everything is fully editable so if you feel that something doesn’t fit with your vision you can change it in minutes. Read the rest of this entry »
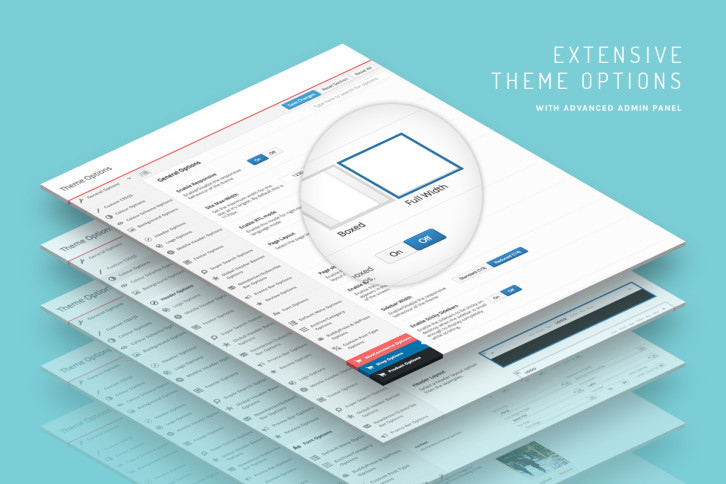
There are a number of important features to look for when selecting any WordPress theme, with some of the more obvious ones being responsiveness, speed, SEO optimization, and ease of customization. This latter feature is often achieved through the use of multiple layouts, and the means of manipulating them. Pre-made layouts can significantly cut down on website development time, without a risk of sacrificing quality. More is better as far as the number of ready to use layouts is concerned. A theme that can boast 100 or more layouts is usually a much more effective website development tool than one that features a single, or a mere handful of these important features. Layout content and quality is important, but the usability and ease of customizing a layout is the real time saver.
Get started with Pre-made Layouts
The pre-made layouts shown here are just a sampling of the large number that are currently available, and they are excellent examples of the design quality web designers look to achieve, and have a right to expect, from a given theme’s offerings. Every one of these layouts is modern in appearance, and eachis an example of the idea-generating features a designer looks for to get a project off to a rapid start. All it usually takes is to watch a demo of one of these layouts to realize they are concepts and not mere pictures, and how useful they can be to get the creation of a web page off to a fast start.
Have you ever noticed that the fonts that you have available on your computer are the same ones that everyone else uses? Graphic design, sign making, and much more can be better when you have a full supply fonts on your computer. The Fontastic Font Bundle is only $29 and provide you with a total of 45 fonts for you to choose from. These can be used for personal and commercial uses, and be installed and used within any program.
Suddenly, you have the ability to create eye-catching signage without having to go and download every font on its own. This is one of the most affordable font bundles that you will ever come across, and the font selection is impressive, ranging from handwritten fonts to classic and elegant fonts.
People are going to take note of what you create when you take advantage of this font bundle, and with it being so affordable, you can’t afford not to have this. There is also free support and an installation guide or Windows as well as Mac computers. When you want more fonts installed on your computer, this Fontastic Font Bundle is exactly what you should purchase and download.
Code Kingdoms wants to inspire kids to learn one of the essential creative skills of the 21st Century – coding. They want kids to have the freedom to have fun and be creative with code, so they built a game that enables just that. In Code Kingdoms, kids build and protect their own worlds and share them with friends.
Code Kingdoms allows kids aged 6 to 13 to learn computational thinking alongside a real coding language, whilst promoting soft skills like problem-solving, teamwork and time management. They encourage kids to experiment with code knowing that it won’t always work – breaking things is OK! Getting stuck, debugging and further problem solving are all part of how programming works in the real world.
When we are designing a website, we not only want that site to look great, but we need to make sure that our design encourages people to complete important tasks for which the site was created.
This could be making a purchase, requesting more information, becoming a member, or some other action that turns a random visitor into an actual customer. This is website engagement, and the design decisions that we make in our work can help increase that engagement and the overall success of the website. At Webydo, we are constantly monitoring these decisions to improve the product by understanding customer behavior.
In this article, we will look at 5 design tips that you can use to increase engagement on your next website project.
1. Clear Calls-To-Action
Have you ever been to a website and thought, “what do I do next?†You are not alone. One of the best ways that you can increase website engagement is by making it easy and obvious for customers to determine what they need to do to proceed.
When designing a website, think about the path that visitors should take and then make this path obvious with clear calls-to-action that do not allow those visitors to wonder “what do I do next?†Read the rest of this entry »
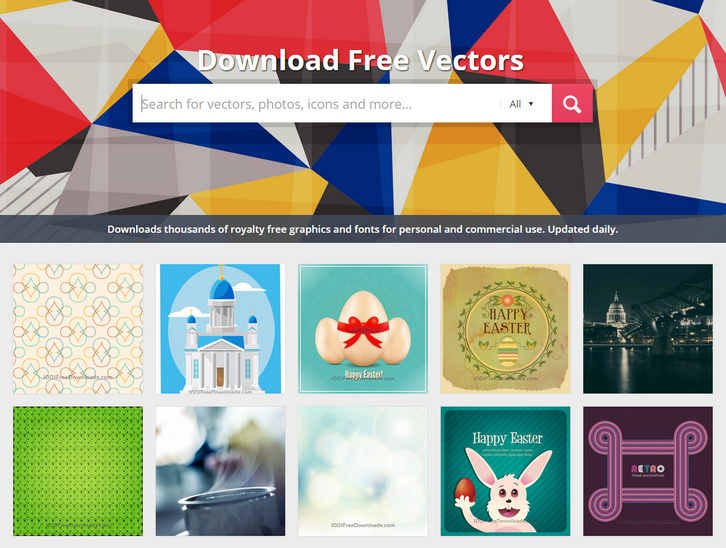
You will find the best and most attractive free graphics for designers at 1001FreeDownloads. They make it easy and fun to search and find the graphics you need in an quick and easy to use platform. They have a collection of tens of thousands of files and they are constantly expanding our content. We have selected the following 15 Free Vector Design Resources for Designers. Enjoy.
Photography and design are the heart of the Internet. Graphics, GIF clips, and artistic photos are important parts of enhancing any experience. The world wide web is full of photographic content; any web search is sure to produce billions of images. While image searches pull up plenty of unique graphics, it is often difficult to find the right sized imagery for your particular need.
1001FreeDownloads.com seeks to surpass all other Internet search experiences with its free catalog of over 1,000 design images and fonts. It is a design resource in its own class.
This unique website provides a variety of content that can be used as templates for scrapbook pages, icons and wallpaper for your computer. The limits are really endless and left to your own imagination. No matter what your passion you are bound to find an image to fit your creative need on this colorful website.
It can be difficult to hire a developer without knowing all of their skills. To avoid problems once you hire them, it’s possible to use a PHP Online Programming Test so you can test the full extent of their knowledge prior to offering them a job.
PHP is a scripting language that is used for a lot of web development. More than 240 million websites have PHP installed on them, so it is a very popular language that is used. Not all programmers have the same level of knowledge and you will want to know what they do and don’t know. Tests for Geeks is there for you.
The PHP/MySQL test (https://tests4geeks.com/test/php-mysql) will be useful when deciding what they know. You can have a candidate take the test and once they have completed it, you will get the results. This will allow you to see how much they know and then decide if you want to hire them.
The test is not designed to take the place of an interview. You may still want to conduct an interview. However, you can narrow down the candidates that you interview by first finding out about the full extent of their PHP knowledge. If they don’t do well on their test, then you may not want to bother with an interview. This will save you time and ensure you’re only interviewing the most qualified of the candidates. Read the rest of this entry »