DHTML AJAX Timeplot for Plotting Time Series and Events
Posted · Category: BSD License, Charts
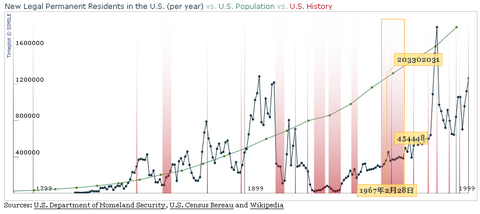
Timeplot is a DHTML-based AJAXy widget for plotting time series and overlay time-based events over them (with the same data formats that Timeline supports). Just like Timeline or Google Maps, Timeplot can be used with zero software installation, server-side or client-side. You can populate Timeplot with data by pointing it to an space or comma separated file. Timeplot also supports Timeline’s XML format, meaning that you can reuse the same data file of your Timeline and overlay them over a time series plot. It looks so specialized and works smoothly. It is a very great charts tool to represent complex data.
Requirements: Any Browsers supprts Javascript
Demo: http://simile.mit.edu/timeplot/
License: BSD License
2 Comments